

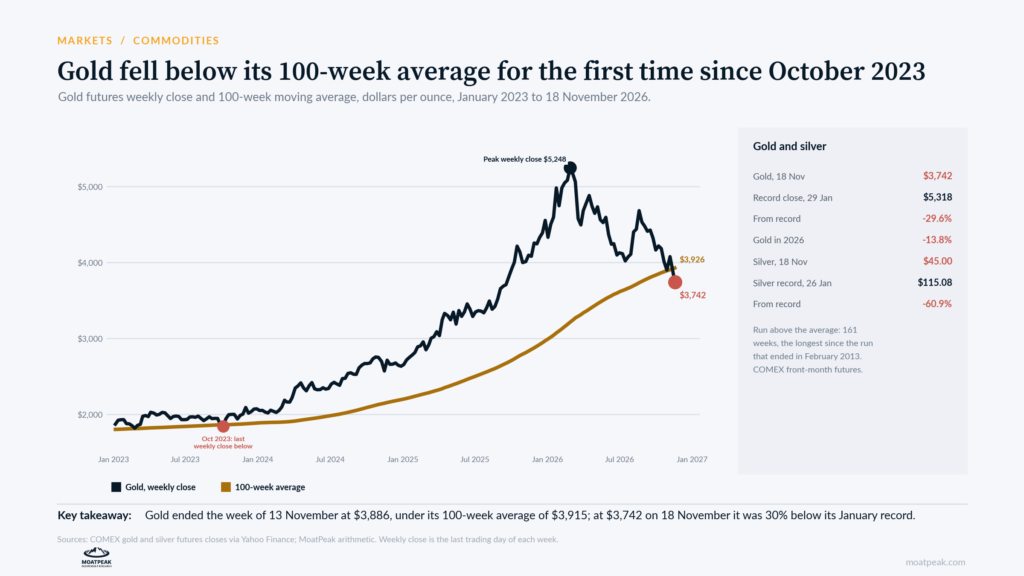
It was the first weekly close below that average since October 2023. The run above it lasted 161 weeks, the longest since one that ended in February 2013.
On 18 November, gold closed at $3,742, 29.6 percent below its 29 January record and down 13.8 percent in 2026. Silver closed at $45.00, 60.9 percent below its 26 January record.
Past breaks give no clear signal. Since 2002, we found five cases in which gold broke below the average after at least six months above it. It was higher a year later after three of them. It fell 18.0 percent after the February 2013 break and rose 44.6 percent after the October 2023 one.
Our read: a 100-week average moves slowly, so a break tends to come after much of the fall. The backdrop matters more. The 10-year Treasury yield reached 5.15 percent on 13 November, and the dollar index hit its highest level since April 2025 on 16 November. Higher bond yields make a metal that pays no income less attractive. We would watch yields more than the moving average.
Research, not advice.
Get the Weekly Explainer
The biggest market story explained, every week. Free, by email.
Explore the research library
Company, industry and market reports with sources, charts, possible outcomes and the full evidence.
More free explainers
Markets, companies, portfolio basics and investing foundations. All free articles.
Back to Learn