

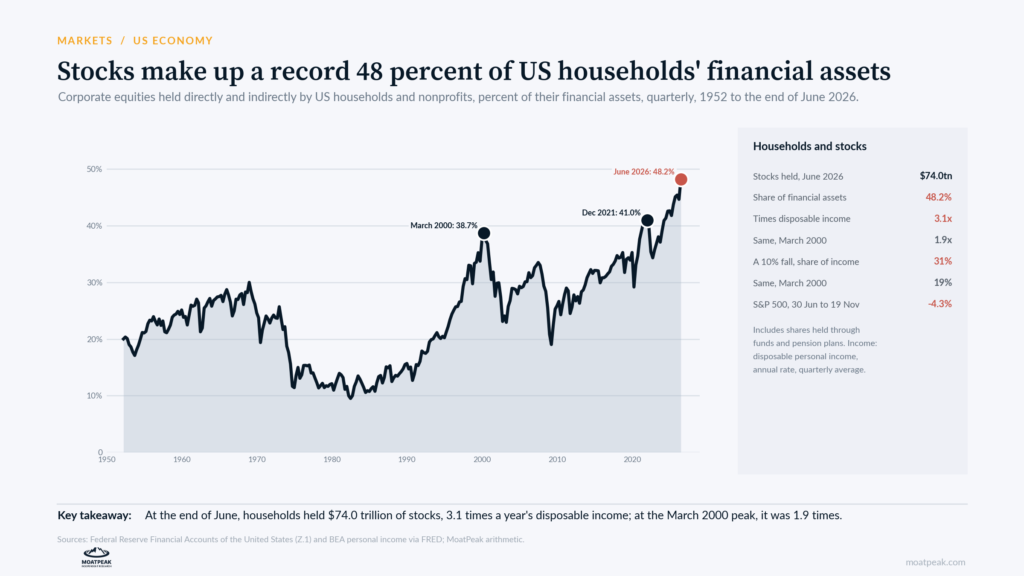
The Fed’s figures go back to 1945. At the peak in March 2000, the share was 38.7 percent. At the end of 2021, it was 41.0 percent.
Households held $74.0 trillion of stocks, 3.1 times a year’s disposable income. In March 2000, the ratio was 1.9.
Our read: by this measure, households have never been this exposed to the stock market. A 10 percent fall in share prices would now erase wealth equal to about 31 percent of a year’s disposable income, against 19 percent in 2000. The S&P 500 fell 4.3 percent from the end of June to 19 November. Spending that rests on paper wealth can turn quickly when prices fall.
Research, not advice.
Get the Weekly Explainer
The biggest market story explained, every week. Free, by email.
Explore the research library
Company, industry and market reports with sources, charts, possible outcomes and the full evidence.
More free explainers
Markets, companies, portfolio basics and investing foundations. All free articles.
Back to Learn