

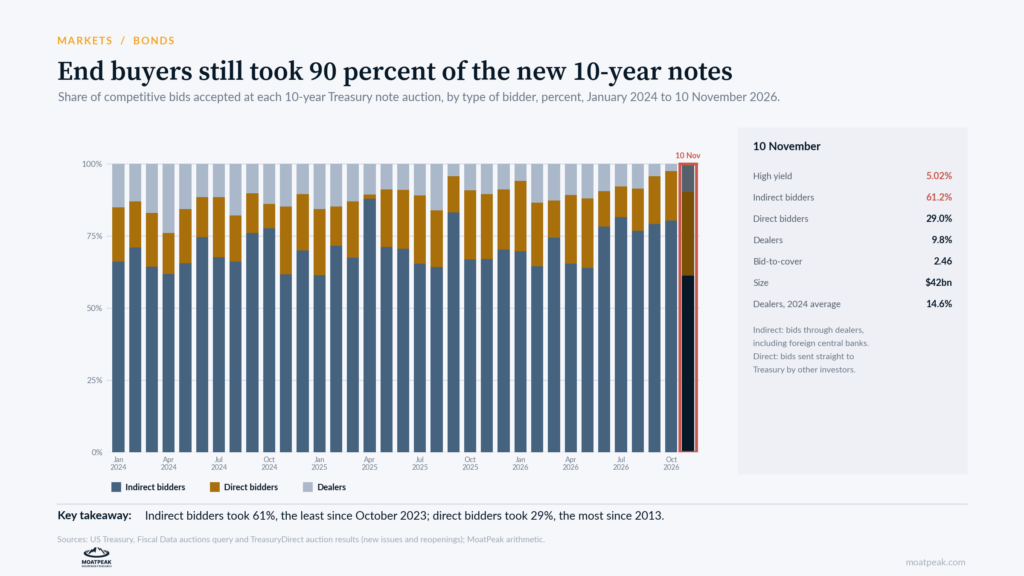
The US Treasury sold $42 billion of new 10-year notes on 10 November at a yield of 5.02 percent. Some headlines called the auction weak. While the mix of buyers changed, the share taken by end investors stayed about the same.
Who bought
Treasury auctions have three kinds of bidders. Primary dealers are the banks that must bid at every auction and take what others do not buy. Indirect bidders place their bids through a dealer; they include foreign central banks and many fund managers. Direct bidders send their bids straight to the Treasury.
On 10 November, indirect bidders took 61.2 percent of the notes sold to competitive bidders, their smallest share since October 2023. Direct bidders took 29.0 percent, their largest share since September 2013. Dealers kept 9.8 percent. Bids totaled 2.46 times the amount sold, the lowest ratio since May.
Together, the two groups of end buyers took 90.2 percent, close to their 2026 average of 91.2 percent. In October, indirect bidders alone took 80.3 percent.
Does a low indirect share last?
We checked all 35 auctions of 10-year notes since January 2024. The indirect share moves around a lot, from 61 to 88 percent. A low reading has told us little about the next one. After the seven auctions in the lowest fifth, the next auction’s indirect share averaged 72 percent, above the 70 percent average for the whole period. The share also had almost no link to the yield level.
The steadier trend is in what dealers keep. They took 14.6 percent of each auction on average in 2024, 11.0 percent in 2025 and 8.8 percent so far in 2026. When dealers keep less, more of the supply goes straight to investors.
The yield tells the story
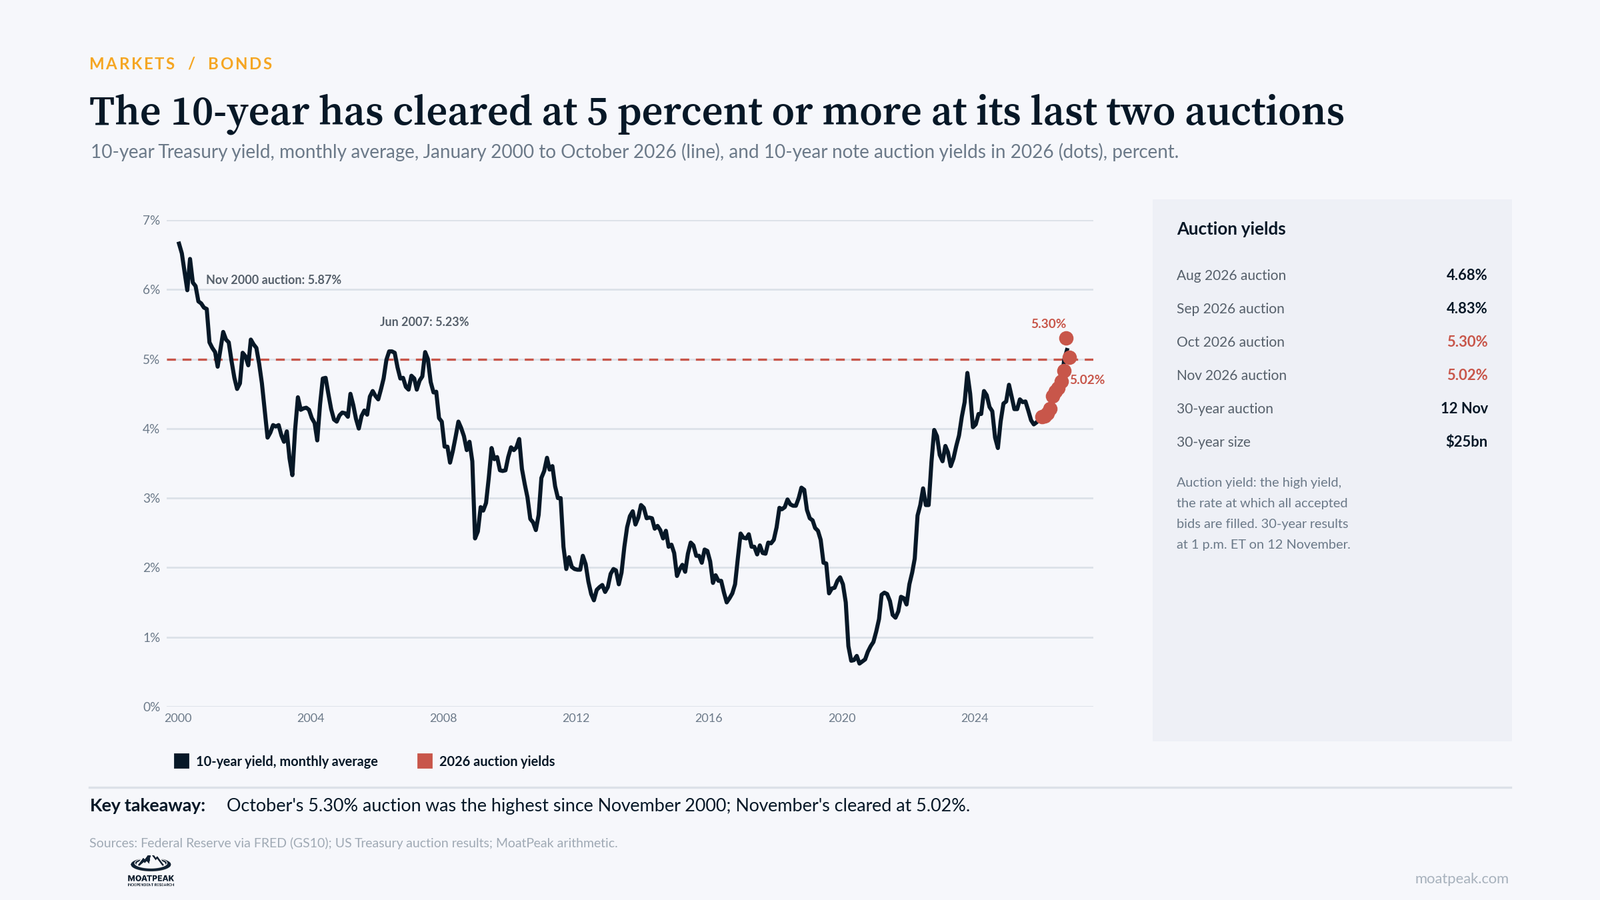
October’s auction cleared at 5.30 percent, the highest yield at a 10-year auction since November 2000. Apart from October’s, no 10-year auction had cleared at 5.02 percent or more since June 2007. This year’s auctions started at 4.17 percent in January. The 10-year yield averaged 5.13 percent in October, its highest monthly average since May 2002.
Investors keep buying, at a price the Treasury has not paid in almost two decades.
Our read
We read the 10 November auction as a change in who bought, with little sign of a buyers’ strike. End investors took their usual 90 percent, and dealers kept less than their 2024 average. In our test, a low indirect share has not predicted another low one.
The key number is the yield. The Treasury now pays about 5 percent to borrow for 10 years, and buyers have accepted that price at two auctions in a row. For households, it feeds into mortgage rates and other long-term borrowing costs, which follow the 10-year yield.
The case against us
The shift may matter more than our test suggests. Direct bidders can include fast-moving funds that sell soon after an auction. Indirect bidders include foreign central banks, which tend to hold for longer. If the buyer base is moving toward short-term holders, demand could fade quickly when markets turn.
The bid-to-cover ratio of 2.46 was also the lowest since May. With fewer spare bids, there is less cushion if supply keeps rising.
What it means for your money
- Watch the price before the mix. A single auction’s buyer mix has said little about the next one. The yield the Treasury pays is what moves mortgage rates and other borrowing costs.
- Know the trade-off at 5 percent. A 10-year note now pays more than at almost any auction since 2007. Its price falls if yields keep rising, and bond funds with long maturities carry the same risk.
- Check what dealers keep. If dealers start taking 15 percent or more again, that would be a clearer sign that investors are stepping back.
What we are watching
- The 30-year bond auction, 12 November, 1 p.m. New York time: $25 billion of new bonds, and whether indirect bidders return.
- The next 10-year auction in December: whether the indirect share moves back toward its 2026 average of 72 percent.
- Dealers’ share: whether it stays below 10 percent, as it has at every 10-year auction since June.
Educational research only. Not personalized investment advice. MB “MoatPeak Group”.
Get the Weekly Explainer
The biggest market story explained, every week. Free, by email.
Explore the research library
Company, industry and market reports with sources, charts, possible outcomes and the full evidence.
More free explainers
Markets, companies, portfolio basics and investing foundations. All free articles.
Back to Learn